Defining the modern consumer ecosystem
Consumer ecosystem analysis in Web3 is the practice of mapping how users interact across a fragmented landscape of blockchains, applications, and financial instruments. Unlike traditional market research, which often looks at a single brand or a siloed product category, this approach treats the entire digital infrastructure as a living network. You are not just studying a customer; you are studying their movement through a multi-chain environment where identity, assets, and data flow freely between platforms.
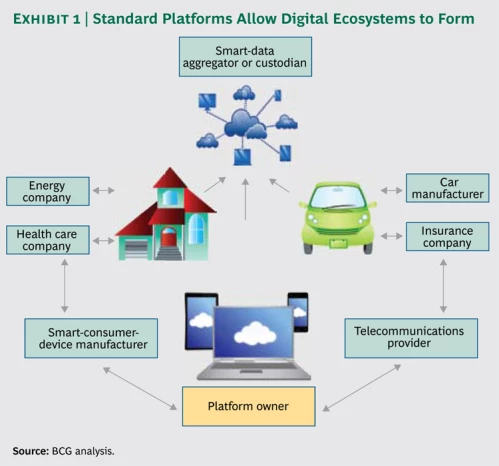
Think of the modern Web3 consumer ecosystem as a dynamic city rather than a static store. In a traditional retail model, you track foot traffic into one building. In Web3, a user might mint an NFT on Ethereum, bridge it to Solana for trading, provide liquidity in a DeFi protocol, and vote on a DAO proposal—all within a single session. Consumer ecosystem analysis maps these cross-chain behaviors to understand the full journey, not just the final transaction.
This distinction is critical because the tools and metrics that work for Web2 fail in this context. Traditional analytics rely on cookies and centralized databases, which do not exist in the same way in decentralized networks. Instead, analysis must rely on on-chain data, wallet clustering, and protocol-level metrics to piece together a coherent picture of user intent and behavior.
The goal is to identify where value flows and where users drop off across this complex web. By understanding the ecosystem holistically, researchers can spot emerging trends, such as the migration of liquidity between chains or the adoption of new social tokens, before they become mainstream. This provides a competitive edge that siloed analysis simply cannot offer.
Building the Data Aggregation Layer
Consumer ecosystem analysis in Web3 requires stitching together fragmented data from Layer 1s, Layer 2s, DeFi protocols, and NFT marketplaces. Unlike traditional finance, where data lives in centralized ledgers, Web3 data is distributed across thousands of independent nodes. To get a complete view, you need an infrastructure layer that ingests, normalizes, and indexes this raw blockchain data.
Think of this layer as the nervous system of your analysis. It pulls raw transaction logs from the mempool, processes them through protocol-specific decoders, and structures them into queryable tables. Without this aggregation, you are looking at isolated pixels rather than the full picture. Tools like The Graph or custom subgraph deployments act as the indexers, translating complex smart contract interactions into readable JSON structures.
Connect to RPC nodes or archive services to pull raw blocks and transactions. This is the raw material—unprocessed, high-volume, and noisy.
Apply ABI (Application Binary Interface) definitions to translate hex data into human-readable function calls and events. This step turns cryptic hashes into actionable insights like "swap" or "transfer."
Store the decoded data in a time-series database. This allows for efficient querying across different chains, enabling you to compare TVL (Total Value Locked) or volume across Ethereum and Solana side-by-side.
To understand the market context for these data flows, it helps to look at the underlying asset volatility. When the market moves, the volume of data spikes, testing the resilience of your aggregation infrastructure.
This infrastructure doesn't just store history; it enables real-time alerts and dashboards. By aggregating data at this level, you can track cross-chain arbitrage opportunities or monitor liquidity shifts before they hit mainstream news. The goal is to reduce latency between on-chain events and your analytical models, ensuring your consumer ecosystem analysis reflects the current state of the market, not yesterday's.
Tracking user behavior in the Web3 consumer ecosystem
Analyzing user behavior in Web3 requires looking beyond simple click-through rates. We are dealing with a fragmented landscape where on-chain activity intersects with off-chain sentiment. Tools have evolved to stitch these data points together, allowing researchers to map the full journey of a digital asset holder.
The modern stack relies on specialized platforms that aggregate wallet interactions with social signals. These tools help identify not just what a user bought, but why they engaged. By correlating transactional data with community sentiment, analysts can predict shifts in market momentum before they fully materialize on the order book.
Understanding these interactions is critical for accurate Consumer Ecosystem analysis. When you see a spike in unique active wallets, it often signals a shift in retail interest. However, without context, that number is just noise. The right software provides that context by layering behavioral data over historical price action.
For a broader view of market health, it helps to watch the dominant asset class. Ethereum remains the primary layer for these consumer interactions, making its price action a leading indicator for ecosystem activity.
Choosing the Right Consumer Ecosystem Analysis Framework
When mapping a Web3 consumer ecosystem, the methodology you pick dictates what you see—and what you miss. Network topology maps who connects to whom, revealing hubs and vulnerabilities, while utility-based analysis measures value flow and exchange efficiency. Neither is universally superior; the right choice depends on whether you are auditing structural risk or forecasting adoption velocity.
Network Topology vs. Utility-Based Approaches
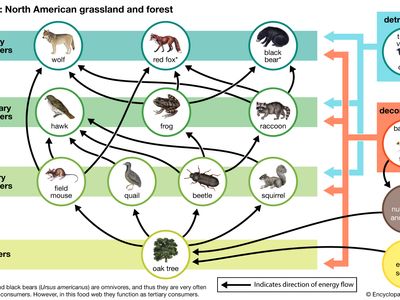
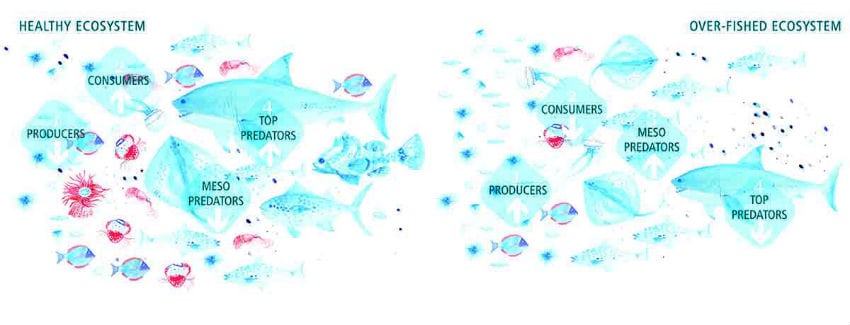
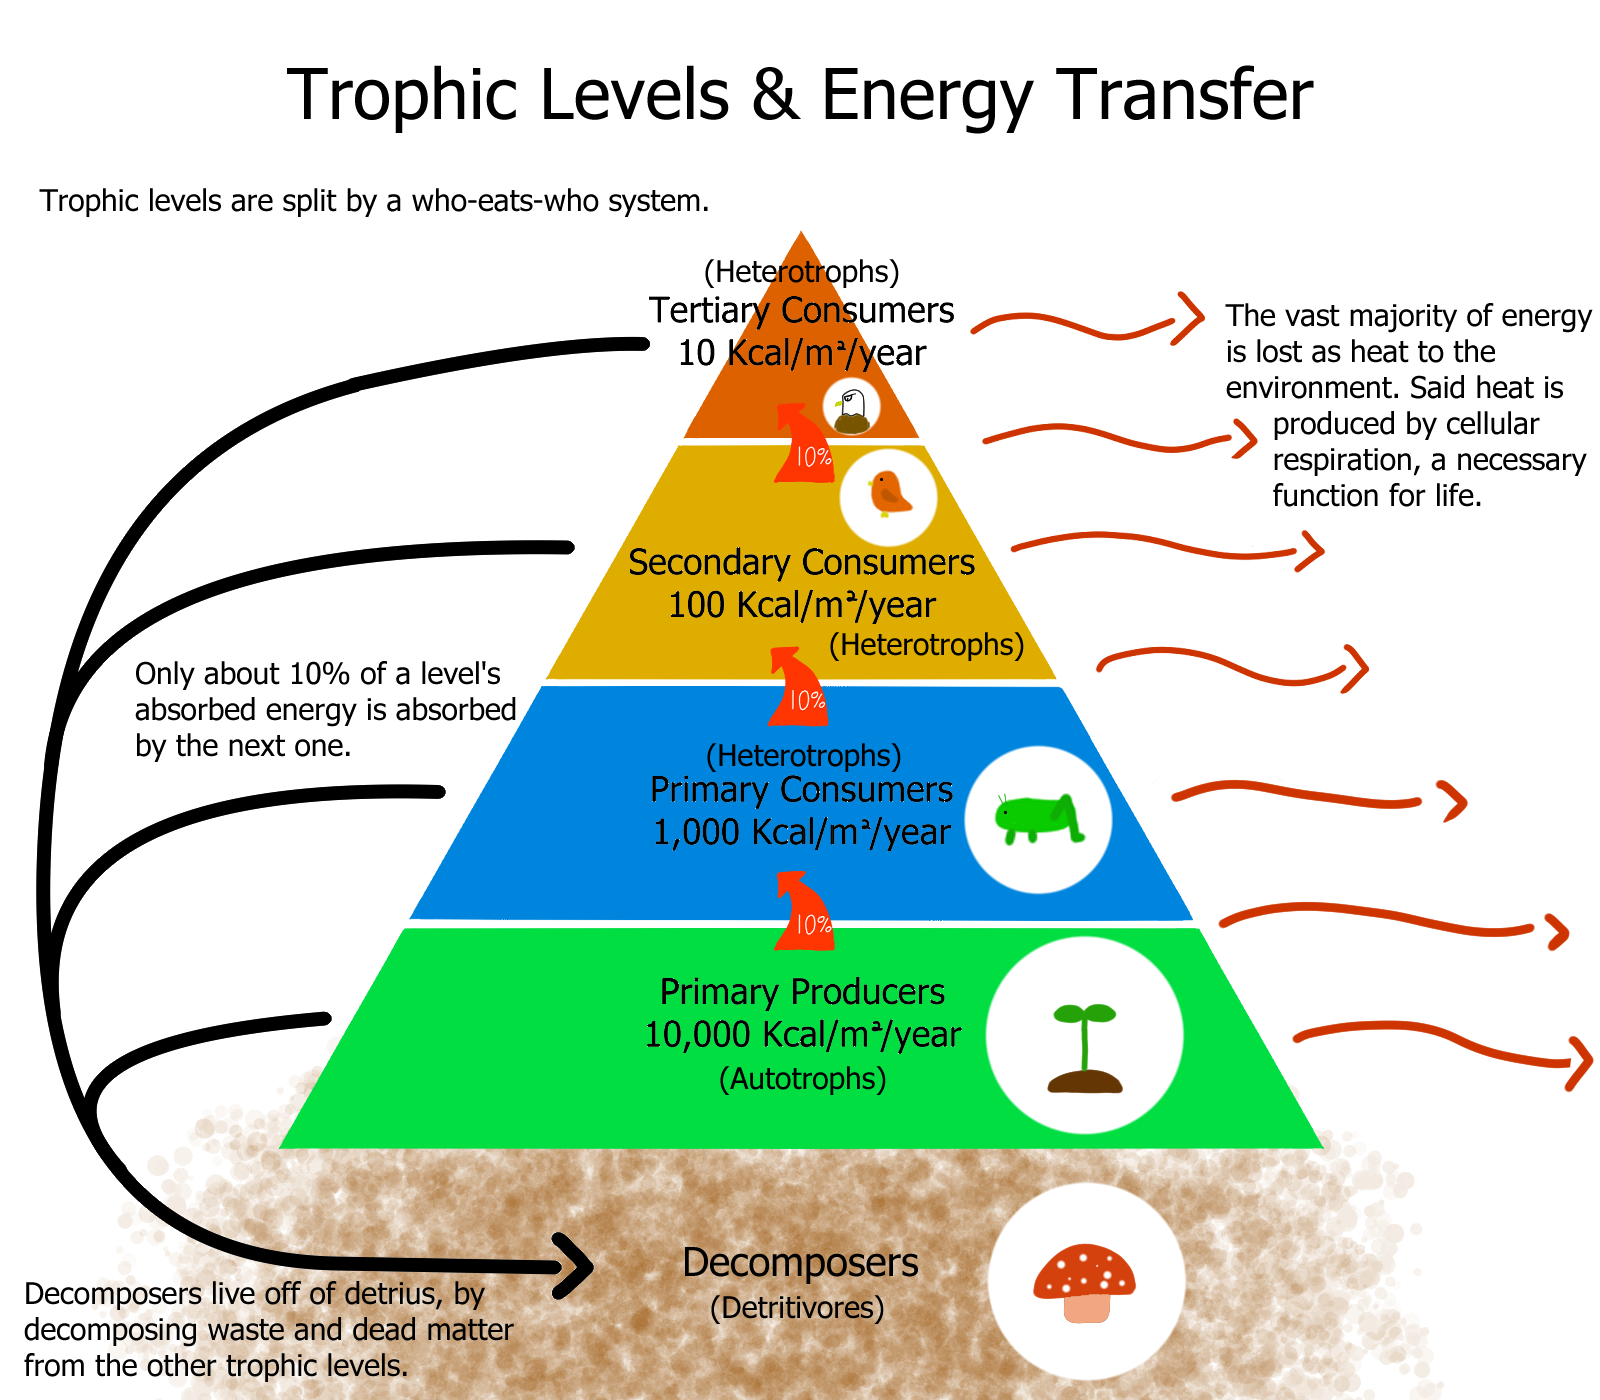
Network topology treats the ecosystem as a graph. It identifies central nodes (protocols or platforms) and peripheral users. This is ideal for spotting single points of failure or influencer-driven volatility. Utility-based analysis, conversely, focuses on the "why"—what value is exchanged and how it circulates. It’s better for understanding retention and long-term sustainability. Research comparing mixed trophic impact and utility analysis shows that combining both yields the most robust insights, but starting with one clarifies your initial hypothesis [src-serp-1].
Comparison of Methodologies
| Feature | Network Topology | Utility-Based |
|---|---|---|
| Primary Metric | Node centrality & edge density | Value exchange volume & efficiency |
| Best For | Risk assessment, contagion modeling | Adoption forecasting, revenue modeling |
| Data Source | Transaction graphs, social links | Usage stats, tokenomics, engagement |
| Complexity | High (requires graph theory) | Medium (requires economic modeling) |
Market Context
Ecosystem analysis doesn't happen in a vacuum. The health of the underlying assets often correlates with the robustness of the network structure. Use the following tools to monitor the market conditions that influence your analysis.
When to Pivot
If your research goal is to identify which protocols are most resilient to shocks, stick with network topology. If you are evaluating the long-term viability of a token model, utility-based analysis is more appropriate. Many successful consumer ecosystem analyses begin with a utility framework to define the "rules of the game" and then overlay network topology to see how players actually behave within those rules.
Build a repeatable consumer ecosystem analysis workflow
A structured approach turns scattered Web3 data into actionable intelligence. By standardizing how you collect, validate, and synthesize market signals, you reduce bias and ensure your consumer ecosystem analysis holds up under scrutiny.
Start by identifying the specific layers of the Web3 stack you are analyzing—whether that’s DeFi protocols, NFT marketplaces, or Layer 2 solutions. Map out the primary data sources, such as on-chain explorers, governance forums, and social sentiment aggregators, to ensure you are capturing the full breadth of the ecosystem.
Collect quantitative data on active addresses, transaction volumes, and token velocity. Pair this with qualitative signals from Discord, Twitter, and governance proposals. This dual-layer approach captures both the mechanical health of the network and the human sentiment driving it.
Web3 data can be noisy or manipulated. Cross-reference on-chain metrics with third-party analytics platforms like Dune Analytics or Nansen. Look for discrepancies in volume or unusual wallet activity that might indicate wash trading or bot-driven engagement, ensuring your consumer ecosystem analysis reflects organic growth.
Combine the validated data into a coherent narrative. Identify key user personas, their primary pain points, and the tools they actually use versus what they say they want. This synthesis transforms raw numbers into a clear picture of the current consumer landscape.
Present your findings with clear visualizations and actionable recommendations. Set up a recurring schedule to update this analysis, as Web3 ecosystems evolve rapidly. Regular updates allow you to spot emerging trends early and adjust your strategy accordingly.
To ground your analysis in real-time market conditions, monitor the performance of major ecosystem tokens. Tracking price action and technical indicators can reveal broader market sentiment that often precedes shifts in consumer behavior.
Helpful gear
Use these product recommendations as a starting point, then choose the size, material, and price point that fit how you actually use the gear.


As an Amazon Associate, we may earn from qualifying purchases.
No comments yet. Be the first to share your thoughts!