Why consumer ecosystem analysis matters
Traditional market research was built for centralized companies. It relies on surveys, focus groups, and sales data from a single point of control. But Web3 is not a single company. It is a network of protocols, tokens, and decentralized autonomous organizations (DAOs). When you try to apply old-school customer analysis to this environment, the picture is blurry at best and wrong at worst.
Consumer ecosystem analysis looks at the entire health of the network, not just one brand's performance. It asks who the participants are, what roles they play, and how value flows between them. You aren't just tracking users; you are tracking interactions across chains, wallets, and communities. If you only look at off-chain sentiment, you miss the actual on-chain activity that drives real adoption.
This distinction is why you need specialized analysis tools. Generic analytics platforms cannot parse the complexity of decentralized networks. They cannot trace a token's journey from a liquidity pool to a final holder without specialized infrastructure. To make sense of Web3, you need tools that understand the ecosystem as a living, breathing organism rather than a static database.
Top tools for ecosystem mapping
Mapping a Web3 consumer ecosystem is less about drawing a static chart and more about tracking a living network. You need to see who holds the liquidity, who influences the narrative, and how value flows between protocols. The right tools turn this chaos into a readable map, highlighting key actors and hidden dependencies before they become bottlenecks.
We’ve tested the platforms that actually handle the volume of on-chain data without freezing. These aren’t abstract concepts; they are concrete software solutions used by analysts to track real-time consumer behavior across DeFi, NFT, and social layers.
Arkham Intelligence
Arkham has become a go-to for visualizing wallet clusters. It doesn’t just show transactions; it labels entities like exchanges, venture capital firms, and known influencers. This labeling is critical for consumer ecosystem analysis because it lets you see who is actually moving funds, not just anonymous addresses. You can track the flow of capital from top-level investors down to retail wallets, revealing the true shape of community support.
Nansen
Nansen focuses on "smart money" tracking. It tags wallets based on their historical performance, allowing you to filter for wallets that consistently profit from specific sectors. If you are analyzing consumer trends in a new protocol, Nansen lets you see if early adopters are speculative traders or long-term holders. This distinction is vital for understanding whether a community is building genuine utility or just chasing pumps.
Dune Analytics
Dune is the workhorse for custom queries. While it requires SQL knowledge, its dashboard community provides thousands of pre-built templates for tracking user growth, active wallets, and token velocity. For ecosystem mapping, Dune allows you to slice data by specific timeframes or protocol upgrades, giving you granular control over your analysis. It’s less about pre-made visuals and more about building the exact metrics that matter to your specific research question.
| Tool | Best For | Data Depth | Learning Curve |
|---|---|---|---|
| Arkham | Entity labeling and visual clusters | High (labeled data) | Low |
| Nansen | Smart money and token tracking | High (behavioral tags) | Medium |
| Dune | Custom metrics and historical data | Very High (SQL-based) | High |
The plumbing behind the dashboard
You can build a beautiful UI for consumer ecosystem analysis, but it collapses without reliable data underneath. Real-time research doesn't happen in a vacuum; it runs on a stack of aggregators and APIs that must stay live while markets shift. If your infrastructure hiccups, you miss the signal in the noise.
Think of this backend as the nervous system of your research. It collects raw signals from dozens of blockchain endpoints and social feeds, then feeds them into your analysis tools. The goal is consistency. You need a setup that doesn't drop packets when transaction volume spikes or when a new protocol launches unexpectedly.
Choosing the right data aggregators
Not all data providers are built for the same speed. Some excel at historical depth, while others prioritize low-latency updates for active trading. For ecosystem analysis, you need the latter. Look for providers that offer real-time indexing of smart contract events. This allows you to track consumer behavior as it happens, rather than waiting for daily exports.
Reliability is the main differentiator. When you're comparing tools, check their uptime history and query limits. A platform that throttles your requests during peak hours is useless for continuous monitoring. You want a partner that handles the heavy lifting of data normalization so you can focus on the insights.
API reliability and latency
Latency matters more than you might think. In fast-moving Web3 ecosystems, a delay of a few seconds can mean missing the early signs of a trend or a rug pull. Your API connections need to be robust, with fallback options if one node goes down.
Most professional setups use a combination of primary and secondary nodes. This redundancy ensures that your consumer ecosystem analysis tools stay connected even if a major provider experiences an outage. Test your chosen tools with high-volume queries before committing. If the response times degrade under load, find a different provider.
Visualizing the flow
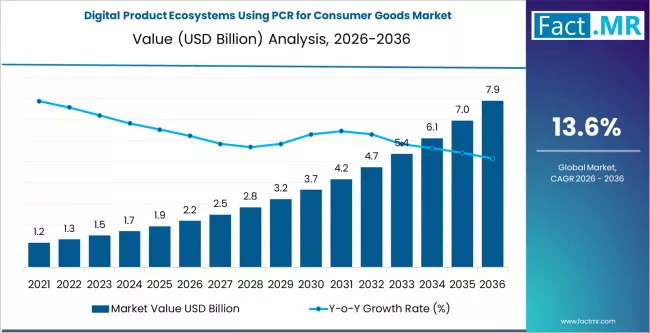
Seeing the data in motion helps clarify how these tools interact. A technical chart can illustrate the volume spikes that your infrastructure must handle.
Building a consumer strategy
Raw data from your consumer ecosystem analysis tools is useless if it sits in a dashboard. The goal is to turn those metrics into a concrete plan for keeping users engaged. Think of your ecosystem like a garden: you can measure the soil pH all day, but you only care about whether the plants are growing. In Web3, growth means retention, not just new wallet connections.
Start by identifying your core user cohorts. Are they long-term holders, active traders, or casual participants? Each group needs a different engagement strategy. Use your analytics platform to segment these users. Look for patterns in how they interact with your protocol. Do they log in daily? Do they hold tokens for months? These behaviors tell you what matters to them.
Next, focus on community health. High transaction volume is nice, but it doesn’t mean people like your product. Look at discussion quality on Discord or Twitter. Are users asking for help, or are they just shilling? Tools that track sentiment and engagement depth will help you spot trouble before it spreads. A silent community is a dying one.
Finally, set clear retention goals. Define what "success" looks like for each cohort. Is it 30-day active usage? Token staking duration? Once you have these numbers, build features that directly address the gaps. If users drop off after week one, simplify onboarding. If they churn after a month, add loyalty rewards. Your strategy should be a direct response to the data.
Use your analytics tool to segment users by behavior. Don’t just look at demographics; look at action. Who logs in most often? Who holds tokens longest? Pick the top three behaviors that correlate with long-term value.
Move beyond vanity metrics like total users. Track daily active users (DAU) and session length. Use a tool that can show you the user journey. Where do they drop off? Is it after the first transaction or during onboarding? Fix the leaky bucket first.
Set up alerts for negative sentiment on social platforms. High volume with low sentiment is a red flag. Use a platform that can aggregate discussions from Discord, Twitter, and Telegram. Spotting a crisis early saves your reputation.
Create features that reward continued use. This could be staking rewards, exclusive access, or governance rights. Make the next step obvious and valuable. If users don’t see a reason to stay, they will leave.
Common questions about consumer ecosystem analysis
If you are looking for tools to track how people interact with your brand or product, the terminology can get confusing fast. Here is a breakdown of the most frequent questions we get, focused on how to actually get the data you need.
What are the 4 types of consumers in the ecosystem?
In a business context, "consumers" aren't just random buyers; they fall into specific behavioral buckets. Understanding these helps you choose the right analysis tool for each group.
- Primary Consumers (Direct Users): These are the people actively using your product or service. Tools like Mixpanel or Amplitude track their daily habits.
- Secondary Consumers (Observers): These are potential customers watching your content or browsing your site without buying yet. You need heatmaps (like Hotjar) to see where they drop off.
- Tertiary Consumers (Influencers): These are people who talk about your product to others. Social listening tools like Brandwatch help you track their sentiment.
- Quaternary Consumers (Critics): These are users who have churned or left negative feedback. Support ticket analysis is key here to understand why they left.
How to perform a consumer analysis?
You don't need a PhD to analyze consumers, but you do need a structured approach. Most effective tools follow a similar workflow:
- Define your audience: Before opening any software, write down exactly who you are trying to reach.
- Gather data: Use your chosen platform to pull metrics. This could be survey responses, click-through rates, or session recordings.
- Identify pain points: Look for patterns in the data. Where are users getting stuck? What features are they ignoring?
- Analyze competitors: See what your rivals are doing better. Tools like SEMrush or Ahrefs can show you their traffic sources.
- Take action: Use the insights to update your product or marketing strategy. Analysis is useless without action.
What is ecosystem analysis?
Ecosystem analysis is the process of mapping out all the players involved in your market. It includes your customers, competitors, suppliers, and regulators. For consumer-focused research, it means looking beyond just your product to see the entire environment in which your users live.
Think of it like looking at a city map instead of just one building. You need to see the roads (distribution channels), the other buildings (competitors), and the people (consumers) to understand how the city functions. This holistic view helps you spot opportunities that a narrow focus might miss.
What are the 4 types of ecosystem services?
This question often comes up when discussing the broader impact of consumer behavior. In environmental and economic terms, these are the benefits humans get from nature and systems:
- Provisioning Services: Tangible goods like food, water, and raw materials.
- Regulating Services: Benefits from natural processes like climate regulation and water purification.
- Cultural Services: Non-material benefits like recreational, aesthetic, and spiritual experiences.
- Supporting Services: Necessary functions like soil formation and nutrient cycling that allow other services to exist.
While these are ecological terms, they apply to business ecosystems too. A healthy consumer ecosystem provides "supporting" infrastructure (like reliable APIs) that allows "provisioning" services (your product) to function.
Helpful gear
Use these product recommendations as a starting point, then choose the size, material, and price point that fit how you actually use the gear.


As an Amazon Associate, we may earn from qualifying purchases.
No comments yet. Be the first to share your thoughts!