Defining the consumer ecosystem
When we talk about a consumer ecosystem in finance, we aren’t talking about biology. It’s not about food chains, herbivores, or the four types of ecological environments like forests or deserts. Instead, it refers to the interconnected network of digital touchpoints, financial products, and data flows that surround a user’s financial life.
Think of it as a web rather than a straight line. In the past, analyzing a customer meant tracking a linear journey: see an ad, click a link, buy a product. Today, that journey is fragmented. A user might check their balance on a banking app, read a Reddit thread about investing, compare rates on a fintech site, and finally execute a trade—all within an hour. This is the consumer ecosystem.
Consumer ecosystem analysis maps these non-linear interactions. It looks at how different services influence each other and how data moves between them. According to industry glossaries, ecosystem analytics focuses on using data from key metrics to understand the entire network of relationships within your channel ecosystem impartner.com. This means looking beyond single transactions to understand the whole context of user behavior.
The shift from linear customer journeys to non-linear ecosystems requires a new way of measuring success.
By focusing on this broader network, analysts can identify hidden opportunities and risks that traditional, siloed metrics miss. It’s about seeing the forest, not just the individual trees.
Network analysis methodologies
Consumer ecosystem analysis moves beyond simple demographics to map the actual architecture of user interaction. We treat the ecosystem as a dynamic web where nodes represent products or services, and edges represent the flows of data, capital, or influence between them. This approach reveals structural dependencies that standard survey data often misses.
Ecological network analysis (ENA) provides a robust framework for this work. By quantifying the budgets of energy, nutrients, or value flows, ENA allows analysts to evaluate not just direct interactions but also indirect, cascading effects across the entire system. This method highlights which components are central to stability and which are fragile points of failure.
Mixed trophic impact analysis offers a complementary lens. It isolates the direct, pair-wise relationships between specific nodes while simultaneously tracking the indirect consequences of those interactions. Together, these methodologies provide a high-resolution view of the ecosystem, distinguishing between superficial connections and the structural ties that actually drive consumer behavior.
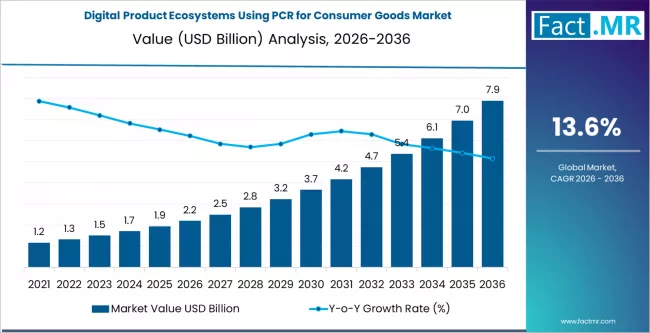
To ground these abstract concepts in real-world volatility, we can observe how network shocks propagate through financial markets. The following chart visualizes the interaction flows and density shifts in a major asset class, serving as a proxy for how consumer sentiment and capital move through a complex, interconnected system.
Key infrastructure components
Consumer ecosystem analysis relies on a robust technological backbone to capture, process, and interpret the complex web of interactions between brands, customers, and third-party services. Unlike traditional linear supply chains, modern ecosystems involve multi-directional data flows that require specialized infrastructure to remain coherent. Without the right tools, organizations struggle to connect disparate data points into a unified view of the customer journey.
The foundation of this analysis typically rests on three pillars: Customer Relationship Management (CRM) integrations for direct interaction data, data lakes for storing unstructured information, and API endpoints for real-time synchronization across platforms. Each component serves a distinct purpose in the broader strategy for understanding consumer behavior.
Infrastructure Stack Comparison
Different organizations approach this challenge with varying levels of integration depth. The table below compares common infrastructure stacks used in consumer ecosystem analysis, highlighting their strengths in data volume, integration speed, and analytical depth.
| Component | Primary Function | Data Type | Integration Complexity |
|---|---|---|---|
| CRM Integration | Tracks direct customer interactions and sales history | Structured | Low |
| Data Lake | Stores raw, unstructured data from diverse sources | Unstructured/Semi-structured | High |
| API Endpoints | Enables real-time data exchange between platforms | Streamed | Medium |
| Data Warehouse | Aggregates cleaned data for historical reporting | Structured | Medium |
CRM Integrations
Customer Relationship Management systems serve as the primary repository for direct consumer interactions. When integrated effectively, CRMs provide a timeline of customer touchpoints, from initial inquiry to post-purchase support. This structured data is essential for mapping the linear aspects of the consumer journey and identifying high-value segments. However, CRMs alone rarely capture the full ecosystem, as they often miss external interactions occurring on social media or third-party marketplaces.
Data Lakes
For a comprehensive consumer ecosystem analysis, organizations must look beyond structured records. Data lakes ingest raw data from IoT devices, social media feeds, and transaction logs, preserving the original format for future processing. This approach allows analysts to uncover hidden patterns in unstructured data, such as sentiment analysis from customer reviews or usage patterns from app telemetry. While powerful, data lakes require significant governance to prevent "swamps" of unusable information.
API Endpoints
APIs act as the connective tissue of the consumer ecosystem, allowing different platforms to communicate in real time. Through well-designed API endpoints, a brand can pull inventory data from a supplier, update customer profiles in their CRM, and trigger marketing campaigns based on live behavior. This real-time capability is critical for dynamic pricing, personalized recommendations, and immediate customer support. The complexity lies in maintaining security and consistency across these numerous connections.
Measuring ecosystem health
Vanity metrics like total downloads or page views often mask the reality of a consumer ecosystem. To truly understand ecosystem health, you need to track metrics that reflect active engagement, retention, and the value exchange between users and the platform. Ecosystem analytics focuses on the network of relationships within that channel, looking at how different parts of the system support or strain one another.
Start with Active User Ratios. DAU/MAU (Daily Active Users to Monthly Active Users) is a classic barometer for habit formation. A high ratio suggests your ecosystem is woven into daily routines, while a low ratio might indicate sporadic usage that won't sustain long-term growth. Pair this with Churn Rate to see if the value you're providing is sticking. High acquisition with high churn is a leaky bucket, regardless of how many new users you pull in.
Don't ignore Cross-Platform Engagement. In a modern consumer ecosystem, users rarely stay in one silo. Track how many users interact with two or more of your products or services. This "stickiness" across touchpoints is a stronger predictor of lifetime value than single-product usage. It signals that the ecosystem itself is the product, not just one feature within it.
Finally, monitor Net Revenue Retention (NRR). This metric captures expansion revenue from existing customers (upsells, cross-sells) minus churn. An NRR above 100% means your ecosystem is growing organically from within, even if you stop acquiring new customers entirely. It’s the ultimate test of whether your ecosystem is creating enough value to keep users investing more over time.
Turn ecosystem analysis into growth levers
Consumer ecosystem analysis is only as valuable as the actions it triggers. You can map every interaction, but growth happens when you identify where friction blocks the journey and where underserved nodes offer easy wins. This section outlines how to move from data to strategy, focusing on tangible levers like referral paths and partnership opportunities.
Find the underserved gaps
Most brands focus on their own touchpoints. A broader view reveals gaps where customers struggle because no single provider owns the solution. Look for moments in the customer journey where data is siloed or service is fragmented. These are your opportunities. By filling these gaps, you create stickiness that competitors cannot easily replicate. This approach shifts your role from vendor to essential infrastructure.
Optimize referral and network effects
Ecosystems thrive on connectivity. Analyze how customers move between different services or products within your sphere of influence. Identify natural referral paths where one interaction logically leads to another. Strengthen these connections with seamless handoffs and shared value propositions. When customers see clear benefits in staying within your ecosystem, churn drops and lifetime value rises.
Build strategic partnerships
No company owns the entire customer journey. Use your analysis to identify complementary players who serve adjacent needs. Partner with them to create bundled experiences or shared loyalty rewards. This expands your reach without the heavy lift of building new capabilities from scratch. Choose partners who share your customer quality standards to protect brand integrity.
Measure the right outcomes
Traditional metrics like click-through rates often miss the bigger picture. Track cross-service engagement and referral conversion rates instead. These indicators show whether your ecosystem strategies are actually moving customers through the funnel. If a partnership isn’t driving meaningful cross-pollination of users, cut ties and reallocate resources. Keep your strategy lean and focused on high-impact areas.

As an Amazon Associate, we may earn from qualifying purchases.
Common questions on ecosystem metrics
Understanding consumer ecosystem analysis requires distinguishing between biological definitions and business applications. While ecology defines ecosystems through biotic and abiotic interactions, market analysis focuses on how consumer behaviors, supply chains, and regulatory factors interconnect. Clarifying these metrics helps analysts avoid conflating natural systems with commercial ones.
These metrics provide a structured way to evaluate market health. By applying these definitions, analysts can better predict shifts in consumer behavior and supply chain resilience.
No comments yet. Be the first to share your thoughts!